Noisy Miner
Manorina melanocephala
ABR description
The following is extracted from the Annual Bird Report for the twelve months to June 2017.
Very common, breeding resident
Woodland species commonly observed in Canberra suburbs and surrounding nature parks.
General: Number of records higher than last year as is the reporting rate (5%) still 43% above 30YA. Since 1991, the reporting rate has increased dramatically from 4.3% to a peak of 25% this year. The number of WOO records was the same as last year. Max 60/10 July Mt Ainslie NR (OrY1), the mean dropped from 7.0 to 4.9 and the median from 4 to 3. 49 breeding records, close to the highest number of records (54) from two years ago, and more than twice the 30YA: first nb/16 Jul Mt Ainslie NR (HoS1); last dy/27 Feb Sutton GrO10 (McD1).
GBS: Recorded at 59% of sites, similar to last year, but in decreased numbers. Between 1982 and 2004 the abundance hovered around A=0.2. Since then the abundance has dramatically increased year after year to its highest level of A=1.5186 last year. This year it is slightly lower A=1.4907. Max 25/2wk Oct Ainslie GrL13 (HaS3), mean 4.4, median 3. 63 breeding records from 7 sites, more records than last year (39) but from fewer sites: first nb/2wk Jul Bonner GrL10 (GrB1); last dy/3wk May Ainslie (HaS3), with an early start to the next breeding season co/2wk June Ainslie (HaS3).

Abundance
Abundance is the average number of birds of that species per survey. Where the species was observed (presence recorded) but the number of birds seen was not recorded, this is treated as a count of zero.
Abundance by year
This chart shows the abundance of Noisy Miner between 1982 and 2017. 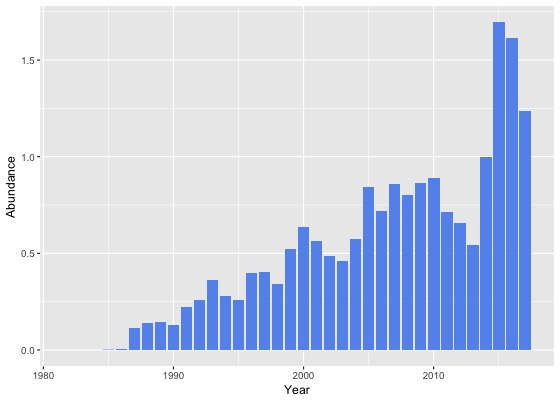
Abundance by month
This chart shows the monthly abundance of Noisy Miner. The blue lines show the abundance for the twelve months to June 2017 and the bars show the average abundance for the period 1982 to 2017. 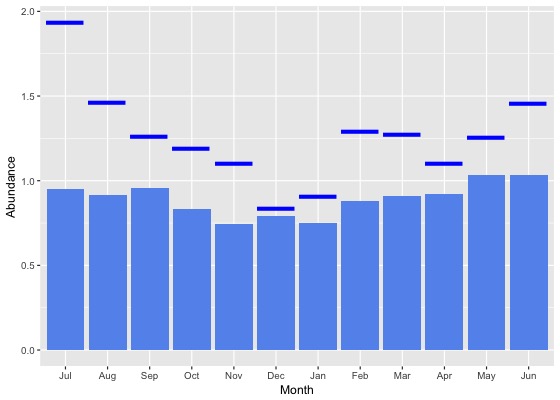
Abundance by season
This chart shows the seasonal abundance of Noisy Miner. The blue lines show the seasonal abundance for the twelve months to June 2017 and the bars show the average seasonal abundance for the period 1982 to 2017. 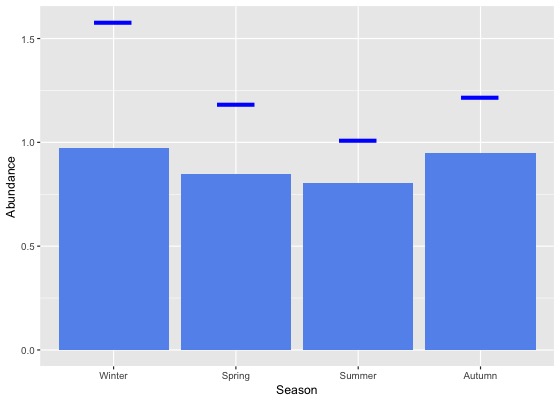
Abundance data
| Month | Season | ||||||||||||||||||
|---|---|---|---|---|---|---|---|---|---|---|---|---|---|---|---|---|---|---|---|
| Period | Jul | Aug | Sep | Oct | Nov | Dec | Jan | Feb | Mar | Apr | May | Jun | Winter | Spring | Summer | Autumn | All | ||
| All years | |||||||||||||||||||
| All | 1.0 | 0.9 | 1.0 | 0.8 | 0.7 | 0.8 | 0.8 | 0.9 | 0.9 | 0.9 | 1.0 | 1.0 | 1.0 | 0.8 | 0.8 | 0.9 | 0.9 | ||
| Previous years | |||||||||||||||||||
| All previous years | 0.8 | 0.8 | 0.9 | 0.8 | 0.7 | 0.8 | 0.7 | 0.8 | 0.8 | 0.9 | 1.0 | 1.0 | 0.9 | 0.8 | 0.8 | 0.9 | 0.8 | ||
| Previous 30 years | 0.8 | 0.8 | 0.9 | 0.8 | 0.7 | 0.8 | 0.7 | 0.8 | 0.9 | 0.9 | 1.0 | 1.0 | 0.9 | 0.8 | 0.8 | 0.9 | 0.8 | ||
| Previous 20 years | 1.0 | 1.0 | 1.1 | 0.9 | 0.9 | 0.9 | 0.8 | 0.9 | 1.0 | 1.0 | 1.2 | 1.1 | 1.1 | 0.9 | 0.9 | 1.1 | 1.0 | ||
| 10 year groups | |||||||||||||||||||
| [2007,2017) | 1.2 | 1.2 | 1.3 | 1.0 | 1.0 | 1.1 | 0.9 | 1.1 | 1.1 | 1.2 | 1.4 | 1.3 | 1.3 | 1.1 | 1.0 | 1.2 | 1.1 | ||
| [1997,2007) | 0.6 | 0.6 | 0.6 | 0.5 | 0.5 | 0.6 | 0.4 | 0.5 | 0.7 | 0.6 | 0.7 | 0.7 | 0.6 | 0.5 | 0.5 | 0.6 | 0.6 | ||
| [1987,1997) | 0.2 | 0.2 | 0.2 | 0.2 | 0.2 | 0.3 | 0.2 | 0.1 | 0.3 | 0.2 | 0.2 | 0.2 | 0.2 | 0.2 | 0.2 | 0.2 | 0.2 | ||
| 5 year groups | |||||||||||||||||||
| [2012,2017) | 1.4 | 1.4 | 1.4 | 1.1 | 1.1 | 1.1 | 1.0 | 1.2 | 1.2 | 1.5 | 1.7 | 1.5 | 1.4 | 1.2 | 1.1 | 1.4 | 1.3 | ||
| [2007,2012) | 0.6 | 0.8 | 1.0 | 0.9 | 0.8 | 0.9 | 0.5 | 0.6 | 0.7 | 0.7 | 0.7 | 1.1 | 0.9 | 0.9 | 0.7 | 0.7 | 0.8 | ||
| [2002,2007) | 0.6 | 0.7 | 0.6 | 0.4 | 0.5 | 0.7 | 0.4 | 0.5 | 0.8 | 0.7 | 0.7 | 0.7 | 0.7 | 0.5 | 0.6 | 0.7 | 0.6 | ||
| [1997,2002) | 0.7 | 0.4 | 0.6 | 0.6 | 0.5 | 0.5 | 0.4 | 0.5 | 0.5 | 0.5 | 0.7 | 0.6 | 0.6 | 0.6 | 0.5 | 0.6 | 0.5 | ||
| [1992,1997) | 0.2 | 0.3 | 0.3 | 0.3 | 0.3 | 0.6 | 0.3 | 0.2 | 0.4 | 0.2 | 0.3 | 0.4 | 0.3 | 0.3 | 0.3 | 0.3 | 0.3 | ||
| [1987,1992) | 0.1 | 0.1 | 0.2 | 0.1 | 0.1 | 0.1 | 0.2 | 0.1 | 0.2 | 0.2 | 0.1 | 0.1 | 0.1 | 0.1 | 0.1 | 0.2 | 0.1 | ||
| Year | |||||||||||||||||||
| 2017 | 1.9 | 1.5 | 1.3 | 1.2 | 1.1 | 0.8 | 0.9 | 1.3 | 1.3 | 1.1 | 1.3 | 1.5 | 1.6 | 1.2 | 1.0 | 1.2 | 1.2 | ||
| 2016 | 2.3 | 1.7 | 1.7 | 1.5 | 1.8 | 1.6 | 1.3 | 1.2 | 1.6 | 1.8 | 1.6 | 1.7 | 1.9 | 1.6 | 1.3 | 1.7 | 1.6 | ||
| 2015 | 1.3 | 2.0 | 2.0 | 1.3 | 1.0 | 1.5 | 1.6 | 2.0 | 1.3 | 1.9 | 2.9 | 2.0 | 1.8 | 1.4 | 1.7 | 1.9 | 1.7 | ||
| 2014 | 0.9 | 0.9 | 0.7 | 1.0 | 0.9 | 0.7 | 0.7 | 1.3 | 1.2 | 1.0 | 1.5 | 1.1 | 1.0 | 0.9 | 0.9 | 1.2 | 1.0 | ||
| 2013 | 0.7 | 0.4 | 0.8 | 0.6 | 0.7 | 0.4 | 0.3 | 0.3 | 0.6 | 0.5 | 0.4 | 1.0 | 0.7 | 0.7 | 0.4 | 0.5 | 0.5 | ||
| 2012 | 0.6 | 0.4 | 0.9 | 0.7 | 0.5 | 0.8 | 0.6 | 0.3 | 0.6 | 0.9 | 0.3 | 0.7 | 0.6 | 0.7 | 0.6 | 0.7 | 0.7 | ||
| 2011 | 1.1 | 0.4 | 1.0 | 1.4 | 0.8 | 0.5 | 0.4 | 0.4 | 0.5 | 0.7 | 0.2 | 0.8 | 0.8 | 1.2 | 0.5 | 0.5 | 0.7 | ||
| 2010 | 0.6 | 0.7 | 0.9 | 0.9 | 0.9 | 1.0 | 0.4 | 0.7 | 1.0 | 0.7 | 0.9 | 1.3 | 1.0 | 0.9 | 0.7 | 0.9 | 0.9 | ||
| 2009 | 0.8 | 0.6 | 1.3 | 1.0 | 0.8 | 1.1 | 0.8 | 0.9 | 0.9 | 0.5 | 0.3 | 0.8 | 0.8 | 1.0 | 1.0 | 0.6 | 0.9 | ||
| 2008 | 0.4 | 0.8 | 1.0 | 0.5 | 0.8 | 0.7 | 0.8 | 0.4 | 0.7 | 0.8 | 1.4 | 1.6 | 1.0 | 0.7 | 0.6 | 0.9 | 0.8 | ||
| 2007 | 0.3 | 1.3 | 0.8 | 0.8 | 0.8 | 1.4 | 0.6 | 0.8 | 0.7 | 0.6 | 1.1 | 0.9 | 0.9 | 0.8 | 1.0 | 0.8 | 0.9 | ||
| 2006 | 0.6 | 1.4 | 0.9 | 0.7 | 0.7 | 0.8 | 0.3 | 0.9 | 0.8 | 0.5 | 0.4 | 0.7 | 0.8 | 0.8 | 0.6 | 0.7 | 0.7 | ||
| 2005 | 1.0 | 0.6 | 0.7 | 0.3 | 0.9 | 0.9 | 0.7 | 0.7 | 1.3 | 0.8 | 1.2 | 0.9 | 0.9 | 0.6 | 0.8 | 1.1 | 0.8 | ||
| 2004 | 0.4 | 0.5 | 0.7 | 0.4 | 0.3 | 0.4 | 0.5 | 0.4 | 0.6 | 1.3 | 0.7 | 0.8 | 0.5 | 0.5 | 0.4 | 0.9 | 0.6 | ||
| 2003 | 0.3 | 0.6 | 0.4 | 0.3 | 0.4 | 0.7 | 0.5 | 0.5 | 0.4 | 0.4 | 0.3 | 0.5 | 0.5 | 0.4 | 0.6 | 0.4 | 0.5 | ||
| 2002 | 0.6 | 0.6 | 0.5 | 0.3 | 0.4 | 0.6 | 0.3 | 0.2 | 0.7 | 0.5 | 0.3 | 0.6 | 0.6 | 0.4 | 0.4 | 0.6 | 0.5 | ||
| 2001 | 0.7 | 0.3 | 0.5 | 0.6 | 0.8 | 0.6 | 0.3 | 0.7 | 0.5 | 0.6 | 0.7 | 0.6 | 0.5 | 0.6 | 0.5 | 0.6 | 0.6 | ||
| 2000 | 1.0 | 0.7 | 0.8 | 0.6 | 0.7 | 0.5 | 0.3 | 0.7 | 0.5 | 0.7 | 0.6 | 0.8 | 0.8 | 0.7 | 0.5 | 0.6 | 0.6 | ||
| 1999 | 0.1 | 0.2 | 0.5 | 0.4 | 0.4 | 0.5 | 0.8 | 0.1 | 0.6 | 0.3 | 1.0 | 0.7 | 0.5 | 0.4 | 0.5 | 0.6 | 0.5 | ||
| 1998 | 0.4 | 0.0 | 1.0 | 0.4 | 0.1 | 0.3 | 0.5 | 0.1 | 0.2 | 0.2 | 0.2 | 0.1 | 0.1 | 0.5 | 0.3 | 0.2 | 0.3 | ||
| 1997 | 0.3 | 0.5 | 0.2 | 0.7 | 0.3 | 0.2 | 0.2 | 0.4 | 1.6 | 0.3 | 0.1 | 0.6 | 0.5 | 0.4 | 0.2 | 0.5 | 0.4 | ||
| 1996 | 0.1 | 0.2 | 0.5 | 0.4 | 0.3 | 0.5 | 0.2 | 0.2 | 0.7 | 0.1 | 0.4 | 0.9 | 0.4 | 0.4 | 0.3 | 0.5 | 0.4 | ||
| 1995 | 0.2 | 0.1 | 0.1 | 0.1 | 0.2 | 0.4 | 0.3 | 0.1 | 0.6 | 0.3 | 0.3 | 0.4 | 0.2 | 0.1 | 0.3 | 0.4 | 0.3 | ||
| 1994 | 0.4 | 0.6 | 0.3 | 0.5 | 0.3 | 0.5 | 0.2 | 0.0 | 0.2 | 0.2 | 0.1 | 0.2 | 0.4 | 0.3 | 0.2 | 0.2 | 0.3 | ||
| 1993 | 0.3 | 0.5 | 0.4 | 0.3 | 0.5 | 1.0 | 0.4 | 0.0 | 0.2 | 0.1 | 0.5 | 0.0 | 0.3 | 0.4 | 0.5 | 0.3 | 0.4 | ||
| 1992 | 0.2 | 0.1 | 0.2 | 0.2 | 0.4 | 0.6 | 0.0 | 0.4 | 0.1 | 0.5 | 0.3 | 0.2 | 0.1 | 0.3 | 0.4 | 0.3 | 0.3 | ||
| 1991 | 0.1 | 0.1 | 0.6 | 0.1 | 0.4 | 0.1 | 0.4 | 0.1 | 0.4 | 0.3 | 0.0 | 0.2 | 0.1 | 0.3 | 0.2 | 0.2 | 0.2 | ||
| 1990 | 0.1 | 0.1 | 0.1 | 0.1 | 0.1 | 0.1 | 0.2 | 0.2 | 0.1 | 0.3 | 0.2 | 0.1 | 0.1 | 0.1 | 0.2 | 0.2 | 0.1 | ||
| 1989 | 0.1 | 0.1 | 0.1 | 0.2 | 0.1 | 0.1 | 0.2 | 0.1 | 0.2 | 0.2 | 0.1 | 0.1 | 0.1 | 0.1 | 0.2 | 0.2 | 0.1 | ||
| 1988 | 0.1 | 0.1 | 0.1 | 0.1 | 0.1 | 0.1 | 0.2 | 0.2 | 0.2 | 0.1 | 0.1 | 0.2 | 0.1 | 0.1 | 0.2 | 0.1 | 0.1 | ||
| 1987 | 0.0 | 0.0 | 0.1 | 0.1 | 0.1 | 0.1 | 0.1 | 0.1 | 0.1 | 0.1 | 0.1 | 0.1 | 0.1 | 0.1 | 0.1 | 0.1 | 0.1 | ||
| 1986 | 0.0 | 0.0 | 0.0 | 0.0 | 0.0 | 0.0 | 0.0 | 0.0 | 0.0 | 0.0 | 0.0 | 0.0 | 0.0 | 0.0 | 0.0 | 0.0 | 0.0 | ||
| 1985 | 0.0 | 0.0 | 0.0 | 0.0 | 0.0 | 0.0 | 0.0 | 0.0 | 0.0 | 0.0 | 0.0 | 0.0 | 0.0 | 0.0 | 0.0 | 0.0 | 0.0 | ||
| 1984 | 0.0 | 0.0 | 0.0 | 0.0 | 0.0 | 0.0 | 0.0 | 0.0 | 0.0 | 0.0 | 0.0 | 0.0 | 0.0 | 0.0 | 0.0 | 0.0 | 0.0 | ||
| 1983 | 0.0 | 0.0 | 0.0 | 0.0 | 0.0 | 0.0 | 0.0 | 0.0 | 0.0 | - | 0.0 | 0.0 | 0.0 | 0.0 | 0.0 | 0.0 | 0.0 | ||
| 1982 | - | 0.0 | - | 0.0 | 0.0 | 0.0 | - | 0.0 | - | 0.0 | - | 0.0 | 0.0 | 0.0 | 0.0 | 0.0 | 0.0 | ||
Reporting rates
Reporting rate is the proportion of all surveys in which the species was present.
Reporting rate by year
This chart shows the reporting rate of Noisy Miner each year between 1982 and 2017. 
Reporting rate by month
This chart shows the reporting rate by month of Noisy Miner. The blue lines show the reporting rate for the twelve months to June 2017 and the bars show the average reporting rate for the period 1982 to 2017. 
Reporting rate by season
This chart shows the seasonal reporting rate of Noisy Miner. The blue lines show the seasonal reporting rate for the twelve months to June 2017 and the bars show the average seasonal reporting rate for the period 1982 to 2017. 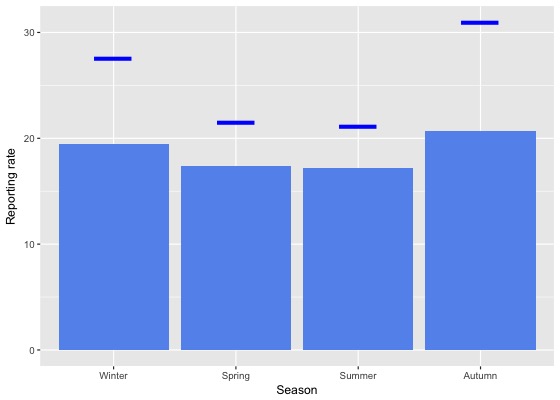
Reporting rate data
| Month | Season | ||||||||||||||||||
|---|---|---|---|---|---|---|---|---|---|---|---|---|---|---|---|---|---|---|---|
| Period | Jul | Aug | Sep | Oct | Nov | Dec | Jan | Feb | Mar | Apr | May | Jun | Winter | Spring | Summer | Autumn | All | ||
| All years | |||||||||||||||||||
| All | 17.5 | 16.6 | 20.4 | 16.1 | 16.1 | 18.0 | 16.6 | 17.0 | 21.3 | 20.8 | 19.8 | 22.9 | 19.5 | 17.4 | 17.2 | 20.7 | 18.6 | ||
| Previous years | |||||||||||||||||||
| All previous years | 16.6 | 15.5 | 19.9 | 15.3 | 15.5 | 17.7 | 16.0 | 15.6 | 19.2 | 19.2 | 17.6 | 20.9 | 18.0 | 16.8 | 16.5 | 18.8 | 17.5 | ||
| Previous 30 years | 16.8 | 15.8 | 20.2 | 15.5 | 15.8 | 18.0 | 16.1 | 15.9 | 19.3 | 19.5 | 17.9 | 21.3 | 18.3 | 17.0 | 16.7 | 19.0 | 17.7 | ||
| Previous 20 years | 19.0 | 17.9 | 22.2 | 16.5 | 17.3 | 19.2 | 16.9 | 17.1 | 20.8 | 21.2 | 20.0 | 23.5 | 20.6 | 18.5 | 17.8 | 20.8 | 19.3 | ||
| 10 year groups | |||||||||||||||||||
| [2007,2017) | 22.0 | 19.9 | 25.1 | 17.8 | 19.2 | 21.5 | 18.5 | 18.9 | 23.0 | 23.4 | 22.1 | 26.0 | 23.2 | 20.2 | 19.6 | 23.0 | 21.3 | ||
| [1997,2007) | 13.7 | 13.4 | 16.3 | 12.3 | 13.6 | 14.8 | 11.6 | 12.3 | 16.1 | 15.2 | 15.0 | 18.1 | 15.4 | 14.2 | 13.2 | 15.5 | 14.5 | ||
| [1987,1997) | 9.2 | 9.5 | 10.1 | 9.6 | 10.5 | 11.3 | 11.6 | 10.3 | 10.8 | 10.9 | 10.1 | 10.2 | 9.7 | 10.1 | 11.1 | 10.6 | 10.3 | ||
| 5 year groups | |||||||||||||||||||
| [2012,2017) | 24.0 | 21.8 | 25.3 | 19.4 | 20.6 | 20.7 | 20.0 | 20.6 | 23.5 | 25.0 | 25.3 | 25.9 | 24.0 | 21.5 | 20.4 | 24.5 | 22.4 | ||
| [2007,2012) | 16.5 | 13.4 | 24.6 | 15.0 | 15.2 | 23.2 | 12.8 | 11.7 | 21.9 | 19.7 | 13.1 | 26.2 | 21.1 | 17.7 | 17.1 | 19.0 | 18.5 | ||
| [2002,2007) | 13.7 | 17.3 | 18.0 | 13.0 | 15.2 | 16.7 | 11.7 | 13.9 | 17.3 | 16.8 | 13.4 | 20.6 | 17.5 | 15.4 | 14.5 | 16.2 | 15.9 | ||
| [1997,2002) | 13.8 | 8.7 | 14.3 | 11.4 | 11.9 | 12.4 | 11.5 | 10.6 | 14.5 | 13.3 | 16.9 | 14.5 | 12.6 | 12.6 | 11.6 | 14.7 | 12.9 | ||
| [1992,1997) | 5.8 | 7.2 | 8.7 | 6.9 | 10.8 | 11.1 | 5.9 | 3.9 | 6.4 | 5.5 | 6.0 | 6.8 | 6.7 | 8.7 | 7.1 | 5.9 | 7.2 | ||
| [1987,1992) | 10.7 | 10.8 | 10.8 | 11.1 | 10.4 | 11.4 | 14.8 | 12.7 | 13.5 | 13.9 | 12.2 | 12.2 | 11.2 | 10.8 | 12.9 | 13.2 | 12.0 | ||
| Year | |||||||||||||||||||
| 2017 | 23.5 | 22.5 | 23.4 | 21.6 | 19.6 | 19.9 | 19.8 | 23.8 | 33.0 | 30.6 | 28.8 | 33.4 | 27.5 | 21.5 | 21.1 | 30.9 | 25.3 | ||
| 2016 | 28.4 | 22.8 | 23.1 | 20.8 | 25.8 | 22.9 | 21.3 | 18.3 | 27.2 | 28.4 | 25.8 | 27.6 | 26.1 | 22.8 | 20.7 | 27.3 | 24.1 | ||
| 2015 | 23.1 | 27.5 | 33.0 | 21.3 | 17.4 | 18.9 | 23.7 | 26.4 | 22.2 | 25.4 | 34.0 | 28.7 | 26.9 | 23.8 | 23.0 | 26.6 | 24.9 | ||
| 2014 | 23.0 | 21.8 | 24.2 | 21.2 | 23.0 | 21.2 | 16.4 | 20.8 | 21.2 | 19.7 | 18.4 | 20.4 | 21.4 | 22.4 | 18.7 | 20.0 | 20.5 | ||
| 2013 | 20.5 | 17.2 | 25.2 | 15.4 | 21.5 | 18.7 | 16.5 | 19.1 | 22.6 | 22.1 | 20.1 | 28.9 | 22.7 | 19.9 | 18.0 | 21.9 | 20.2 | ||
| 2012 | 17.8 | 12.2 | 18.3 | 16.2 | 12.3 | 21.8 | 19.2 | 15.1 | 17.6 | 22.6 | 12.8 | 19.6 | 16.8 | 15.8 | 19.3 | 18.6 | 17.5 | ||
| 2011 | 17.9 | 10.4 | 24.8 | 20.6 | 12.1 | 21.7 | 14.8 | 8.2 | 15.9 | 14.7 | 7.3 | 20.6 | 17.9 | 20.3 | 15.8 | 12.9 | 16.6 | ||
| 2010 | 14.6 | 14.0 | 23.2 | 15.8 | 21.1 | 20.7 | 14.0 | 14.1 | 27.6 | 20.4 | 14.7 | 27.5 | 21.6 | 19.0 | 17.3 | 22.5 | 19.9 | ||
| 2009 | 27.3 | 13.5 | 24.1 | 12.9 | 13.8 | 22.2 | 9.3 | 14.2 | 24.2 | 21.7 | 13.0 | 26.1 | 23.9 | 16.0 | 15.9 | 20.7 | 18.5 | ||
| 2008 | 11.7 | 15.7 | 23.6 | 13.1 | 15.4 | 23.9 | 14.3 | 13.0 | 22.0 | 23.0 | 18.9 | 32.7 | 22.2 | 16.2 | 18.6 | 22.0 | 19.2 | ||
| 2007 | 7.7 | 13.9 | 27.4 | 13.1 | 12.2 | 27.2 | 10.6 | 13.0 | 21.7 | 19.2 | 19.5 | 27.0 | 20.8 | 17.1 | 18.4 | 20.3 | 18.9 | ||
| 2006 | 11.8 | 21.4 | 23.3 | 14.1 | 14.9 | 22.3 | 10.7 | 14.8 | 15.8 | 16.7 | 10.9 | 23.0 | 19.4 | 16.9 | 16.1 | 15.0 | 16.8 | ||
| 2005 | 13.2 | 10.3 | 19.7 | 10.5 | 13.1 | 19.1 | 13.5 | 13.0 | 24.7 | 17.5 | 13.9 | 21.4 | 16.8 | 15.3 | 16.3 | 19.0 | 16.9 | ||
| 2004 | 15.5 | 18.4 | 12.5 | 15.1 | 13.4 | 11.1 | 9.7 | 13.1 | 11.9 | 15.4 | 13.6 | 17.2 | 16.8 | 13.6 | 11.0 | 13.6 | 13.9 | ||
| 2003 | 15.4 | 18.0 | 16.1 | 13.5 | 19.7 | 19.5 | 14.1 | 16.5 | 14.3 | 17.5 | 13.2 | 19.9 | 18.0 | 16.5 | 17.2 | 15.3 | 16.7 | ||
| 2002 | 12.0 | 17.8 | 17.4 | 11.2 | 13.5 | 13.6 | 11.3 | 11.2 | 19.5 | 16.7 | 16.5 | 19.9 | 16.5 | 13.9 | 12.5 | 18.0 | 14.9 | ||
| 2001 | 16.4 | 10.8 | 15.7 | 13.0 | 20.5 | 16.7 | 12.0 | 13.9 | 12.3 | 15.6 | 16.2 | 15.8 | 14.6 | 16.0 | 14.5 | 14.2 | 14.9 | ||
| 2000 | 19.0 | 11.8 | 17.2 | 14.1 | 12.5 | 13.4 | 10.7 | 10.5 | 15.5 | 15.5 | 13.6 | 18.8 | 16.6 | 14.6 | 11.7 | 15.1 | 14.2 | ||
| 1999 | 5.9 | 6.2 | 12.6 | 11.3 | 10.4 | 12.5 | 16.8 | 7.9 | 17.8 | 11.9 | 23.9 | 15.4 | 11.9 | 11.5 | 12.4 | 17.7 | 13.7 | ||
| 1998 | 8.1 | 1.9 | 13.8 | 3.3 | 4.4 | 4.7 | 7.4 | 5.7 | 12.9 | 10.3 | 7.4 | 6.7 | 5.5 | 7.6 | 5.7 | 11.3 | 7.4 | ||
| 1997 | 4.6 | 5.2 | 7.3 | 7.9 | 6.8 | 5.8 | 3.9 | 10.5 | 15.0 | 8.3 | 6.7 | 5.6 | 5.1 | 7.3 | 6.6 | 9.3 | 7.0 | ||
| 1996 | 3.0 | 4.3 | 13.3 | 10.5 | 10.2 | 12.1 | 6.8 | 3.5 | 4.9 | 3.1 | 5.2 | 13.8 | 7.3 | 11.1 | 7.7 | 4.5 | 7.9 | ||
| 1995 | 7.5 | 6.2 | 3.9 | 4.3 | 3.6 | 6.9 | 5.3 | 4.8 | 11.2 | 5.6 | 7.8 | 6.4 | 6.6 | 4.0 | 5.7 | 8.0 | 6.0 | ||
| 1994 | 7.8 | 7.8 | 14.7 | 9.3 | 14.7 | 8.7 | 4.4 | 3.4 | 4.5 | 6.9 | 3.8 | 5.6 | 6.9 | 13.1 | 5.2 | 5.4 | 8.0 | ||
| 1993 | 8.2 | 10.3 | 11.3 | 6.7 | 13.6 | 23.9 | 10.2 | 3.1 | 6.2 | 5.0 | 7.8 | 1.4 | 6.6 | 10.3 | 13.4 | 6.4 | 8.7 | ||
| 1992 | 3.1 | 9.3 | 3.5 | 5.3 | 12.5 | 7.9 | 3.4 | 4.9 | 4.2 | 5.1 | 5.3 | 5.0 | 5.6 | 6.8 | 5.6 | 4.9 | 5.8 | ||
| 1991 | 2.4 | 2.1 | 5.8 | 3.9 | 7.2 | 1.4 | 7.1 | 2.0 | 7.9 | 8.5 | 0.0 | 6.0 | 3.0 | 5.6 | 3.3 | 5.5 | 4.3 | ||
| 1990 | 12.3 | 11.4 | 5.4 | 6.1 | 5.6 | 9.7 | 18.1 | 9.9 | 6.8 | 10.7 | 8.2 | 7.9 | 11.1 | 5.7 | 12.6 | 8.6 | 9.5 | ||
| 1989 | 13.3 | 12.5 | 12.2 | 16.5 | 14.1 | 14.8 | 19.7 | 11.9 | 18.9 | 17.9 | 13.8 | 11.3 | 12.4 | 14.4 | 15.4 | 17.1 | 14.7 | ||
| 1988 | 12.1 | 12.7 | 12.9 | 9.0 | 12.8 | 12.8 | 15.1 | 17.7 | 16.3 | 15.0 | 14.1 | 17.9 | 14.0 | 11.5 | 15.1 | 15.2 | 13.8 | ||
| 1987 | 9.1 | 0.0 | 11.7 | 12.5 | 8.7 | 10.4 | 10.8 | 12.9 | 10.5 | 12.3 | 14.0 | 10.3 | 9.6 | 10.7 | 11.5 | 12.3 | 11.3 | ||
| 1986 | 0.0 | 0.0 | 1.9 | 0.0 | 2.1 | 0.0 | 0.0 | 0.0 | 3.2 | 2.0 | 0.0 | 0.0 | 0.0 | 1.5 | 0.0 | 1.8 | 0.9 | ||
| 1985 | 0.0 | 0.0 | 0.0 | 0.0 | 1.8 | 0.0 | 0.0 | 5.9 | 0.0 | 0.0 | 0.0 | 0.0 | 0.0 | 0.5 | 1.2 | 0.0 | 0.5 | ||
| 1984 | 0.0 | 0.0 | 0.0 | 0.0 | 0.0 | 0.0 | 0.0 | 0.0 | 0.0 | 0.0 | 0.0 | 0.0 | 0.0 | 0.0 | 0.0 | 0.0 | 0.0 | ||
| 1983 | 0.0 | 0.0 | 0.0 | 0.0 | 0.0 | 0.0 | 0.0 | 0.0 | 0.0 | - | 0.0 | 0.0 | 0.0 | 0.0 | 0.0 | 0.0 | 0.0 | ||
| 1982 | - | 0.0 | - | 0.0 | 0.0 | 0.0 | - | 0.0 | - | 0.0 | - | 0.0 | 0.0 | 0.0 | 0.0 | 0.0 | 0.0 | ||
Breeding data
Breeding records by month
Number of breeding records by breeding code and month, 2017 and all years| Breeding code | Jul | Aug | Sep | Oct | Nov | Dec | Jan | Feb | Mar | Apr | May | Jun |
|---|---|---|---|---|---|---|---|---|---|---|---|---|
| 2017 | ||||||||||||
| Breeding (BLA code) | 0 | 0 | 0 | 0 | 0 | 0 | 1 | 0 | 0 | 0 | 0 | 0 |
| Carrying Food | 0 | 0 | 0 | 0 | 1 | 0 | 1 | 0 | 0 | 0 | 0 | 0 |
| Copulating | 0 | 0 | 0 | 0 | 0 | 0 | 0 | 0 | 0 | 0 | 0 | 0 |
| Display | 0 | 0 | 1 | 0 | 0 | 0 | 0 | 0 | 0 | 0 | 0 | 0 |
| Dependent young | 0 | 0 | 0 | 11 | 0 | 3 | 4 | 4 | 0 | 0 | 0 | 0 |
| Faecal sac | 0 | 0 | 0 | 0 | 0 | 0 | 0 | 0 | 0 | 0 | 0 | 0 |
| Inspecting hollow | 0 | 0 | 0 | 0 | 0 | 0 | 0 | 0 | 0 | 0 | 0 | 0 |
| Nest building | 1 | 0 | 2 | 1 | 2 | 0 | 0 | 0 | 0 | 0 | 0 | 0 |
| Nest with eggs | 0 | 0 | 0 | 0 | 0 | 0 | 0 | 0 | 0 | 0 | 0 | 0 |
| Nest with young | 0 | 0 | 1 | 3 | 1 | 2 | 0 | 0 | 0 | 0 | 0 | 0 |
| On/leaving nest | 0 | 0 | 2 | 2 | 3 | 1 | 2 | 0 | 0 | 0 | 0 | 0 |
| All years | ||||||||||||
| Breeding (BLA code) | 0 | 1 | 0 | 15 | 0 | 3 | 2 | 1 | 0 | 0 | 0 | 0 |
| Carrying Food | 0 | 1 | 2 | 8 | 3 | 2 | 3 | 0 | 0 | 0 | 0 | 0 |
| Copulating | 0 | 0 | 2 | 0 | 1 | 0 | 0 | 0 | 0 | 0 | 0 | 1 |
| Display | 1 | 0 | 1 | 1 | 0 | 0 | 0 | 0 | 0 | 0 | 0 | 0 |
| Dependent young | 0 | 1 | 23 | 81 | 26 | 33 | 27 | 14 | 4 | 3 | 1 | 2 |
| Faecal sac | 0 | 0 | 0 | 0 | 0 | 0 | 0 | 0 | 0 | 0 | 0 | 0 |
| Inspecting hollow | 0 | 1 | 0 | 0 | 0 | 0 | 0 | 0 | 0 | 0 | 0 | 0 |
| Nest building | 4 | 9 | 17 | 22 | 9 | 1 | 1 | 1 | 3 | 1 | 1 | 2 |
| Nest with eggs | 0 | 0 | 2 | 3 | 1 | 0 | 0 | 0 | 0 | 0 | 0 | 0 |
| Nest with young | 0 | 5 | 23 | 32 | 9 | 4 | 2 | 0 | 0 | 0 | 0 | 0 |
| On/leaving nest | 0 | 1 | 12 | 15 | 17 | 6 | 6 | 0 | 0 | 0 | 0 | 0 |
Breeding records by year
Average number of breeding records per period by breeding code| Period | Breeding (BLA code) | Carrying Food | Copulating | Display | Dependent young | Faecal sac | Inspecting hollow | Nest building | Nest with eggs | Nest with young | On/leaving nest |
|---|---|---|---|---|---|---|---|---|---|---|---|
| All years | |||||||||||
| All | 0.6 | 0.5 | 0.1 | 0.1 | 6.0 | 0.0 | 0.0 | 2.0 | 0.2 | 2.1 | 1.6 |
| Previous years | |||||||||||
| All previous years | 0.6 | 0.5 | 0.1 | 0.1 | 5.5 | 0.0 | 0.0 | 1.9 | 0.2 | 1.9 | 1.3 |
| Previous 30 years | 0.7 | 0.6 | 0.1 | 0.1 | 6.4 | 0.0 | 0.0 | 2.2 | 0.2 | 2.3 | 1.6 |
| Previous 20 years | 1.1 | 0.6 | 0.2 | 0.1 | 7.9 | 0.0 | 0.0 | 2.4 | 0.1 | 3.1 | 2.2 |
| 10 year groups | |||||||||||
| [2007,2017) | 1.8 | 1.0 | 0.1 | 0.2 | 11.5 | 0.0 | 0.1 | 3.9 | 0.2 | 4.7 | 3.7 |
| [1997,2007) | 0.3 | 0.2 | 0.3 | 0.0 | 4.3 | 0.0 | 0.0 | 0.9 | 0.0 | 1.5 | 0.8 |
| [1987,1997) | 0.0 | 0.5 | 0.0 | 0.0 | 3.5 | 0.0 | 0.0 | 1.7 | 0.4 | 0.6 | 0.2 |
| 5 year groups | |||||||||||
| [2012,2017) | 3.0 | 0.8 | 0.0 | 0.4 | 15.2 | 0.0 | 0.2 | 3.0 | 0.4 | 6.4 | 4.0 |
| [2007,2012) | 0.6 | 1.2 | 0.2 | 0.0 | 7.8 | 0.0 | 0.0 | 4.8 | 0.0 | 3.0 | 3.4 |
| [2002,2007) | 0.2 | 0.2 | 0.4 | 0.0 | 5.2 | 0.0 | 0.0 | 1.0 | 0.0 | 1.8 | 0.8 |
| [1997,2002) | 0.4 | 0.2 | 0.2 | 0.0 | 3.4 | 0.0 | 0.0 | 0.8 | 0.0 | 1.2 | 0.8 |
| [1992,1997) | 0.0 | 0.0 | 0.0 | 0.0 | 1.0 | 0.0 | 0.0 | 0.4 | 0.0 | 0.2 | 0.4 |
| [1987,1992) | 0.0 | 1.0 | 0.0 | 0.0 | 6.0 | 0.0 | 0.0 | 3.0 | 0.8 | 1.0 | 0.0 |
| Year | |||||||||||
| 2017 | 1.0 | 2.0 | 0.0 | 1.0 | 22.0 | 0.0 | 0.0 | 6.0 | 0.0 | 7.0 | 10.0 |
| 2016 | 0.0 | 2.0 | 0.0 | 1.0 | 15.0 | 0.0 | 0.0 | 2.0 | 2.0 | 6.0 | 3.0 |
| 2015 | 0.0 | 0.0 | 0.0 | 0.0 | 23.0 | 0.0 | 1.0 | 8.0 | 0.0 | 13.0 | 9.0 |
| 2014 | 2.0 | 0.0 | 0.0 | 1.0 | 16.0 | 0.0 | 0.0 | 4.0 | 0.0 | 7.0 | 4.0 |
| 2013 | 2.0 | 1.0 | 0.0 | 0.0 | 5.0 | 0.0 | 0.0 | 1.0 | 0.0 | 5.0 | 1.0 |
| 2012 | 11.0 | 1.0 | 0.0 | 0.0 | 17.0 | 0.0 | 0.0 | 0.0 | 0.0 | 1.0 | 3.0 |
| 2011 | 1.0 | 2.0 | 0.0 | 0.0 | 12.0 | 0.0 | 0.0 | 2.0 | 0.0 | 6.0 | 5.0 |
| 2010 | 0.0 | 2.0 | 0.0 | 0.0 | 11.0 | 0.0 | 0.0 | 16.0 | 0.0 | 2.0 | 4.0 |
| 2009 | 1.0 | 1.0 | 0.0 | 0.0 | 8.0 | 0.0 | 0.0 | 2.0 | 0.0 | 1.0 | 3.0 |
| 2008 | 1.0 | 1.0 | 0.0 | 0.0 | 5.0 | 0.0 | 0.0 | 2.0 | 0.0 | 3.0 | 5.0 |
| 2007 | 0.0 | 0.0 | 1.0 | 0.0 | 3.0 | 0.0 | 0.0 | 2.0 | 0.0 | 3.0 | 0.0 |
| 2006 | 0.0 | 0.0 | 1.0 | 0.0 | 3.0 | 0.0 | 0.0 | 2.0 | 0.0 | 2.0 | 3.0 |
| 2005 | 0.0 | 1.0 | 0.0 | 0.0 | 7.0 | 0.0 | 0.0 | 1.0 | 0.0 | 2.0 | 1.0 |
| 2004 | 0.0 | 0.0 | 0.0 | 0.0 | 0.0 | 0.0 | 0.0 | 1.0 | 0.0 | 1.0 | 0.0 |
| 2003 | 0.0 | 0.0 | 1.0 | 0.0 | 6.0 | 0.0 | 0.0 | 0.0 | 0.0 | 3.0 | 0.0 |
| 2002 | 1.0 | 0.0 | 0.0 | 0.0 | 10.0 | 0.0 | 0.0 | 1.0 | 0.0 | 1.0 | 0.0 |
| 2001 | 0.0 | 1.0 | 1.0 | 0.0 | 4.0 | 0.0 | 0.0 | 1.0 | 0.0 | 2.0 | 1.0 |
| 2000 | 1.0 | 0.0 | 0.0 | 0.0 | 8.0 | 0.0 | 0.0 | 0.0 | 0.0 | 2.0 | 0.0 |
| 1999 | 1.0 | 0.0 | 0.0 | 0.0 | 2.0 | 0.0 | 0.0 | 2.0 | 0.0 | 2.0 | 1.0 |
| 1998 | 0.0 | 0.0 | 0.0 | 0.0 | 0.0 | 0.0 | 0.0 | 1.0 | 0.0 | 0.0 | 1.0 |
| 1997 | 0.0 | 0.0 | 0.0 | 0.0 | 3.0 | 0.0 | 0.0 | 0.0 | 0.0 | 0.0 | 1.0 |
| 1996 | 0.0 | 0.0 | 0.0 | 0.0 | 1.0 | 0.0 | 0.0 | 2.0 | 0.0 | 1.0 | 1.0 |
| 1995 | 0.0 | 0.0 | 0.0 | 0.0 | 0.0 | 0.0 | 0.0 | 0.0 | 0.0 | 0.0 | 1.0 |
| 1994 | 0.0 | 0.0 | 0.0 | 0.0 | 2.0 | 0.0 | 0.0 | 0.0 | 0.0 | 0.0 | 0.0 |
| 1993 | 0.0 | 0.0 | 0.0 | 0.0 | 2.0 | 0.0 | 0.0 | 0.0 | 0.0 | 0.0 | 0.0 |
| 1992 | 0.0 | 0.0 | 0.0 | 0.0 | 0.0 | 0.0 | 0.0 | 0.0 | 0.0 | 0.0 | 0.0 |
| 1991 | 0.0 | 0.0 | 0.0 | 0.0 | 1.0 | 0.0 | 0.0 | 0.0 | 0.0 | 0.0 | 0.0 |
| 1990 | 0.0 | 0.0 | 0.0 | 0.0 | 1.0 | 0.0 | 0.0 | 0.0 | 0.0 | 0.0 | 0.0 |
| 1989 | 0.0 | 2.0 | 0.0 | 0.0 | 8.0 | 0.0 | 0.0 | 6.0 | 2.0 | 1.0 | 0.0 |
| 1988 | 0.0 | 2.0 | 0.0 | 0.0 | 10.0 | 0.0 | 0.0 | 4.0 | 1.0 | 3.0 | 0.0 |
| 1987 | 0.0 | 1.0 | 0.0 | 0.0 | 10.0 | 0.0 | 0.0 | 5.0 | 1.0 | 1.0 | 0.0 |
| 1986 | 0.0 | 0.0 | 0.0 | 0.0 | 0.0 | 0.0 | 0.0 | 0.0 | 0.0 | 0.0 | 0.0 |
| 1985 | 0.0 | 0.0 | 0.0 | 0.0 | 0.0 | 0.0 | 0.0 | 0.0 | 0.0 | 0.0 | 0.0 |
| 1984 | 0.0 | 0.0 | 0.0 | 0.0 | 0.0 | 0.0 | 0.0 | 0.0 | 0.0 | 0.0 | 0.0 |
| 1983 | 0.0 | 0.0 | 0.0 | 0.0 | 0.0 | 0.0 | 0.0 | 0.0 | 0.0 | 0.0 | 0.0 |
| 1982 | 0.0 | 0.0 | 0.0 | 0.0 | 0.0 | 0.0 | 0.0 | 0.0 | 0.0 | 0.0 | 0.0 |
Distribution map
Distribution - 2017
This map shows the observed distribution of the Noisy Miner for 2017.
The red circles are the grid cells where Noisy Miner have been reported.
The transparency of the red circles indicate how many surveys sheets were submitted for that grid cell; the darker the red the more reliable the data. Of the 315 grid cells with reports, 83 had only one sheet; an example is grid number G26.
The size of the circle represents the reporting rate. The maximum reporting rate for Noisy Miner was 100.0% (eg grid number G26) and the minimum was 1.1% (eg grid number R12). 
Distribution - all years
This map shows the observed distribution of the Noisy Miner for all years.
The red circles are the grid cells where Noisy Miner have been reported.
The transparency of the red circles indicate how many surveys sheets were submitted for that grid cell; the darker the red the more reliable the data. Of the 703 grid cells with reports, 55 had only one sheet; an example is grid number E29.
The size of the circle represents the reporting rate. The maximum reporting rate for Noisy Miner was 100.0% (eg grid number E29) and the minimum was 0.2% (eg grid number Q13). 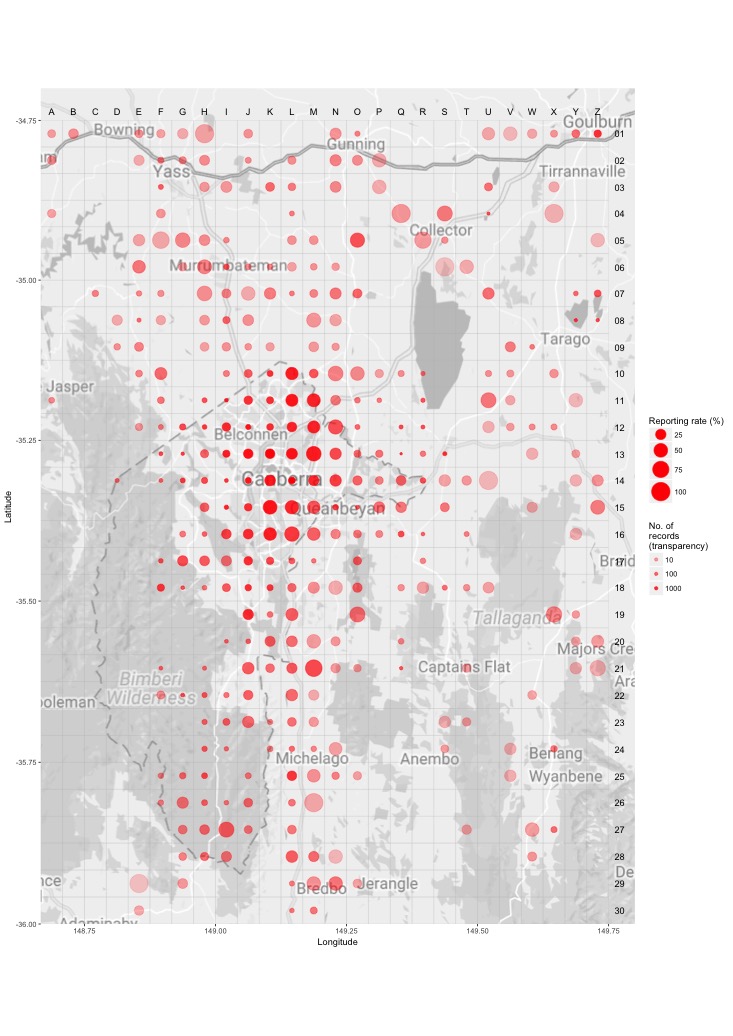
Breeding map
Breeding - 2017
This map shows the breeding distribution of the Noisy Miner for 2017.
The red circles are the grid cells where breeding activity for Noisy Miner have been reported.
The size of the circle represents the number of reports. 
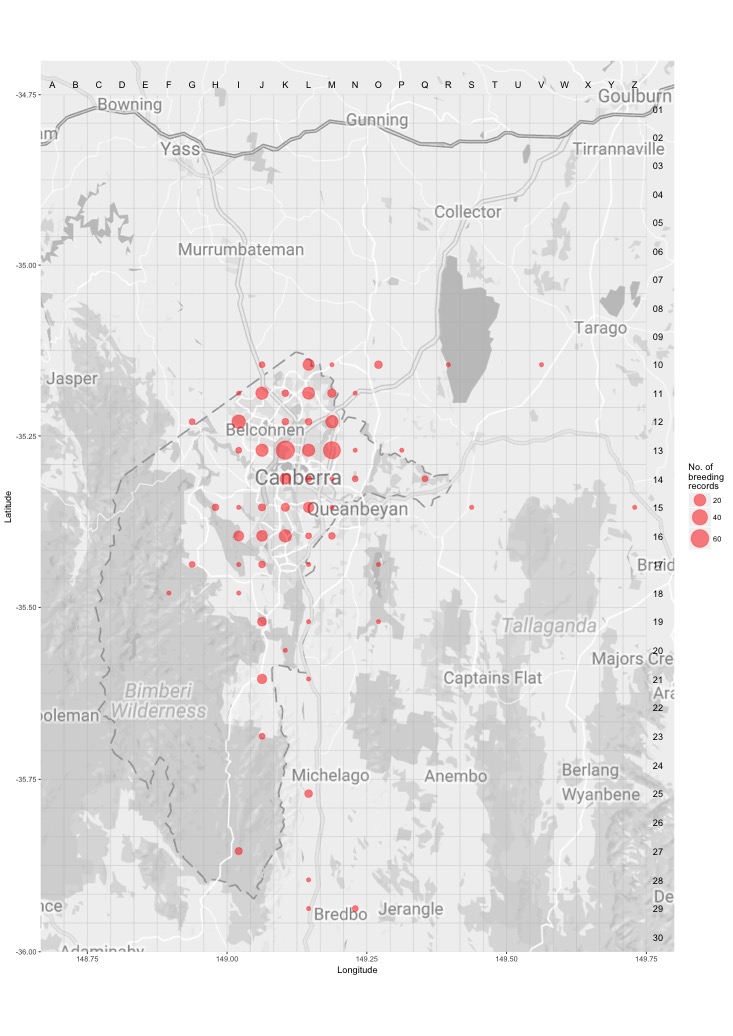
Breeding - all years
This map shows the breeding distribution of the Noisy Miner for all years.
The red circles are the grid cells where breeding activity for Noisy Miner have been reported.
The size of the circle represents the number of reports.